SAP BI MOBILE for Android
Working with SAP BI MOBILE Reports
Each document contains one or more reports. When you open a document, you can view the default
report set by your report designer. If you want to view a specific report, perform the following steps:
1. Tap the document to open it.
The Report screen opens.
2. Tap the Reports dropdown icon on the top left corner of the screen.
3. Select the required report from the dropdown list.
This application provides you with a paging option to display multiple report parts that cannot be displayed
on a single screen. The number at the bottom of the report indicates the number of pages contained
in the report.
You can browse and open a report part in full screen mode by performing the following steps:
1. Tap the page number at the bottom of the screen.
The slider bar appears with a pointer.
2. Drag the pointer on the slider bar to navigate between pages.
As you slide, the number changes to display which page you have navigated to in the report.
3. Tap the report part to view it in full screen mode.
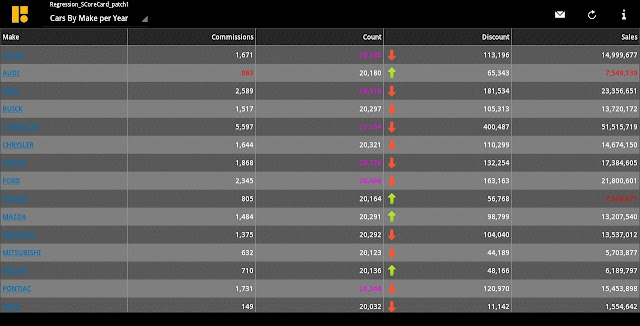
Scorecards represent data from report tables int he form of microcharts (sparklines and gradient fills),
trend status icons, trend buttons and arrows. The purpose of scorecards is to simplify the visual
interpretation of table data.
To view scorecards, it is essential that your report designer configures the vertical and cross tables of
Web Intelligence reports to display them as scorecards on the device. This configuration is done while
designing the report using Web intelligence client tools on the BI platform server.
The figure below displays a vertical bar chart (also called as column chart) as seen in a report:
This application enables you to work with vertical bar charts in the following ways:
• To view a value of a specific bar, tap the bar.
• To view a chart for a specific range (horizontal axis), select and drag the edges of the range selector.
• To hide parameters that you do not want to view, tap the parameter name on the value bar above
the chart
The figure below displays a horizontal bar chart (also called as row chart ) as seen in a report:
It enables you to work with Horizontal bar chart in following ways:
• To view a value of a specific bar, tap the bar.
• To view a chart for a specific range (vertical axis), select and drag the edges of the range selector.
• To hide parameters that you do not want to view, tap the parameter name on the value bar above
the chart.
Stacked bar charts display the values of measures (identified by legends) through stacked bars. These
bars overlap each other. When the value of a measure is negative, the corresponding bar appears in
the stack below the zero level.
Grouped bar charts display data from multiple measures as distinct bars grouped together. The figure
below displays a grouped bar chart as seen in a report:
Pie charts display data as segments of a whole value. Pie charts are useful to show how each part of
your report data contributes to the total.
Pie charts have a single axis displayed on the body of the pie. This is the Y-Axis. Each segment of the
pie chart displays a value for the measure on the Y-Axis. The pie chart legend indicates the dimension
on the X-Axis.
The following figure depicts a pie-chart as seen in a report:
Line charts represent values of a measure via lines in a graph. The figure below displays a line chart
as seen in a report:
Bubble charts represent the values using two measures (X, Y) and one dimension (Z). In bubble charts
the data points are in the form of bubbles.The figure below displays a bubble chart as seen in a report:
This application enables you to work with bubble charts in the following ways:
• To view a value at any particular point on the line chart, tap the required point.
• To view a chart for a specific range, select and drag the slider.
• To hide parameters that you do not want to view, tap the parameter name on the value bar above


Comments
Post a Comment