Posts

Showing posts with the label SAP BO Dashboards

SAP Dashboard Error - Cannot find the BusinessObjects Enterprise report source. (LO 26608)

<!-- Google tag (gtag.js) --> <script async src="https://www.googletagmanager.com/gtag/js?id=G-NL0CYP13VZ"></script> <script>   window.dataLayer = window.dataLayer || [];   function gtag(){dataLayer.push(arguments);}   gtag('js', new Date());   gtag('config', 'G-NL0CYP13VZ'); </script> Cannot find the BusinessObjects Enterprise report source. (LO 26608) Environment SAP BO XI 4.1 SP 5 two nodes Cluster Windows Server 2012 While refreshing dashboard (based on Live Office connection) from BI Launchpad with a no administrator user the above exception was erased. SAP says: Cause The document is not available; for example it does not exist, or it has been removed. Action Check the report path from CMS and use SetLocation in Live Office to re-define the report source. Otherwise, check if the user has sufficient rights to view the object. Solution In our case  we fixed this problem was to remo

SAP BusinessObjects Design Studio (a.k.a. ZEN)

Image
SAP  BusinessObjects  Design Studio  SAP BusinessObjects Design Studio   represents  BEx Web & BEx Web Application Designer successor. Design Stuido allows for intuitive design of centrally governable analytic content ranging from guided analytics to sophisticated OLAP applications and aggregated dashboards.  The product features iPad support, an  HTML5 User Interface, differents themes available for application and a WYSIWYG Eclipse-based designer, full & native support of BW BEx queries, direct connectivity to HANA as well as an advanced scripting engine. Available features in detail: - Intuitive WYSIWYG design environment for designers - Large set of design components (buttons, tabs, dropdown menus etc.) - Extend via scripting language (subset of JavaScript) - Enterprise Ready Life Cycle Management - Central Supportability - Theming & Customizing iPad Support built-in Apps are ready for immediate usage on standard web browsers and mobile

Dashboards on BusinessObjects Mobile BI 4.4

Finally has arrived: BusinessObjects Mobile BI 4.4 wich allows to access to Dashboards on Mobile device and so on IPad and Android Tablet and phones. Dashboard for SAP BI Mobile supported features: Connectivity: through Query Panel on Universes on Query Bex (SAP BW) on Hana Universes Components: Labels Images component Combo box Label based Menu Radio button Scorecard List View Icons Slider Progress Bar Toggle button Push button Charts: Column Chart Bar Chart Pie Chart Line Chart Combination Chart Stacked Bar Chart Stacked Column Chart Gauge Containers: Tab Set Canvass Container Component Groups Please Note that at the moment Prompt component is not available. You will find not compatible components and features on the Compatibility Panel. Keep following the blog for further details and update! Read also Sap Dashboards for ipad Sap BO Dashboards 4 new features

How to install live office XI 3.1 with Office 2010

Image
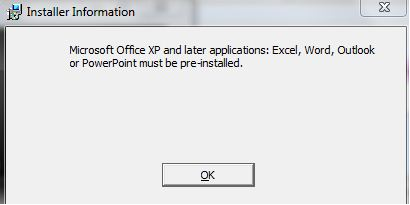
Error: Microsoft Office XP and later applicatations: Excel, Word, Outlook or PowerPoint must be pre-installed. Environment  BO XI 3.1 SP 4 Xcelsius 2008 SP 4 Live Office XI 3.1 SP 4 If you need to install Live Office on a pc with Office 2010 already installed you will get the following warning: In can bypass this error with a  a workaround wich aims to avoid that MS installer checks if Office is installed. In order to do so you need an MSI editor, we suggest http://www.instedit.com/ So follow these steps: Create a copy of   Lifeoffice.msi file located in the Package folder. Open with InstEd the  Lifeoffice . msi file and select the “Tables” tab and click on LaunchCondition; Then delete the row which refers to Office ( “EXCELl10 OR OUTLOOK10″) and save the file. Then run this modified  Lifeoffice.msi,  previous error will not appear any more and you will accomplish your installation! Please note that this Workaround can be used with Xcelsius.msi

Add an opendoc link in a SAP Dashboards

Image
How to add a link in a dashboard  in order to open a document in SAP BI 4 platform First of all I wish you all HAPPY NEW YEAR! Let see how to insert a link to a document  that has been already published on SAP Business Objects 4 platform. Go to Web Connectivity menu in SAP Dashboards  as shown in the following image Select the  URL Button and drag an drop it  in the chosen position on the canvass Then select button Property tab  assign a name to button label  and then insert the appropriate URL in the following format http://BI4Servername:8080/BOE/OpenDocument/opendoc/openDocument.jsp?sIDType=CUID&iDocID=..... In this way, after publishing the dashboard on BILaunchpad  when you will click on the Open Workspace url Button  the related document will be opened: Please read related post: SAP BO 4.0 Open Document

How to Improve Dashboard performances - Decalogue

Improving SAP BO Dashboard performances Decalogue 1. Avoid Excel formulas if is possible so Try to reduce using formulas as much you can 2. Un-nest Excel formula if you can 3. Avoid linking cells 4. Avoid array Excel functions like sumif, sumproduct 5. Limit dashboards components number 6. Reduce or avoid container components 7. Try to make a simple dashboard model in order to make also simple and easy it's maintenance and it's evolution 8. Prefer QaaWS to LiveOffice when connecting to many universes otherwise it’s better using Webi Reports because you can load heavy data by scheduling Webi reports, besides in Webi it’s easier  to do calculations and values  formatting . 9. In order to improve dashboard performances schedule Webi reports, better if not at the same time. 10. If possible you can use triggers on the cells in order to update data from Webi reports. Sap BO Dashboards 4.0 - Xcelsius 2008

World Sales Dashboard template

Image
Let's see how create a  simple Sales Dashboard  which has as main component the Accordion menu which allows to have a multiple level hierarchical filtering. This means that you can first select the top level hierarchy dimension in our case the 'Country' and then you can choose one of the ' Products' sold in the selected country: The columns chart shows the sales for that kind of bike in the months of the year. In the following image you will see how data changed when you select an other kind of product Below  you can see how create the Excel file in order to create this dashboard. In the yellow are will be drilled the months sale data after selecting the two hierarchical dimensions. Under this line there are different tables for each Country that can be selected which contains sales data per product for each months. Below is detailed how to set the Accordion Menu You can find the related files on SAP COMMUNITY NETWORK, in the

Xcelsius Dashboard template files

Image
In order to learn how to create  a Transportation dashboard   you can  study this  dashboard example.  Here you can choose  between 'Company Total' page  and 'Top 5 What if analysis' pages. Let's see the first page   'Company Total' : On the right you can select six labels which corresponds to  different analysis: ABC  2006 Acme 2006 XYX  2006 Total  2006 Total  2005 Same week 2005. All the tabs acts have the same functions. Besides selecting one of the Top ten customer  you will see the drill of related data in the bottom bar charts for each analysis type, follows the image about selecting the 7th customer: The second page is about 'Top 5 What if analysis'  On the left panel, you can see the What if analysis that is you will see all the values and gauges changing on moving the indicator  on the upper graduated bar. Follows the Excel sheet images that provide  data to the dashboard: TOP 200 sheet (Company

SAP Dashboards for IPAD

Image
The last SAP Dashboards SP05 for Mobile (Ipad -Iphone) The last SP05 SAP Dashboards  allows going on mobile (IPAD)  through HTML5  With this last SP you can verify old dashboards you developed in order to use them on Ipad. In this version you cano select  the right size for an iPad screen (1024x768) Beside you have to check the components/parameters in order to verify that are supported for HTML5, this check  is easy to do through a new functionality  for analayze dashboards components compatibility panel. A plus is the chance to choose iOS compatible fonts (Arial, etc. – otherwise, the embedded browser will try to use the best font). Before exporting the reviewed dashboard you can preview it using the mobile viewer option to see how its layout on an iPad: you can choose between: - Fit to screen - Original size Finally you can export  to the server the dashboard and you can  open it  using the SAP BusinessObjects mobile application on the iPad. Mobile co

QaaWs and customized Authentication in Xcelsius

Xcelsius provides an authentication mechanism that enables you to avoid logging into InfoView twice with the same session ID. Take note of following rules if you customize authentication: - An existing session ID is used only if the user name and password are blank (if they are not hard coded or not passed as input values captured by a dialog). This occurs when Query as a Web Service is running in InfoView or Dashboard Manager. - If the user name and password are not blank, then use these values to authenticate the user. No session is created. This is the most scalable scenario and is the preferred option for large-scale usage. - If there is no pre-existing session (and username and password are blank), Xcelsius displays the standard security dialog, in which a session is created. This occurs when Xcelsius designers do not build their own security dialog. See also: Consuming a query as a web service in Xcelsius How to start Query as a Web Service

Consuming a query as a web service in Xcelsius

To consume a query as a web service inside Xcelsius, use the Web Service Connector The Web Service Connector component allows a Flash document created in Xcelsius to communicate with Query as a Web Service through SOAP, using point and click. The Xcelsius Flash document is self-contained and communicates with the web service to display data visually. The only prerequisite is that there be a SOAP-based web service available to the Flash document. The Web Service Connector component, when activated, creates a SOAP-based message (basically an XML document) and sends it to the web service. The web service responds with a SOAP-based message of its own. The Web Service Connector component then sends this data to all the other components, resulting in a live visual representation of your data. There are many public web services available, and many different toolkits and packages for SOAP-based web services. To use public web services and packages that already have a web service on t

How to start Query as a Web Service

This kind of query  is useful because can be used it to consume data into Xcelsius Dashboards in alternative to connecting through Live Office. See: Sap BO Dashboards 4.0 - Xcelsius 2008 Query as a Web Service is used with a Central Management System (CMS) The CMS contains the server component that stores the Query as a Web Service catalog and hosts the published Web Services. When you start Query as a Web Service for the first time, you must define the host server before starting. Each successive time you start Query as a Web Service you select an available host server, then log into the CMS. Once you are logged in, the Query as a Web Service startup Query Catalog page appears.  From this page you can start the query creation and publication wizard to publish a new query and edit existing published queries. How To define a query in Publish as a Web Service Wizard The "Query" page of the "Publish as a Web Service Wizard" allows you to use a quer

Cannot open Excel files after installing Xcelsius - Solution

Image
One problem you often have after Installing Xcelsius 2008 is that you can not open any more Excel file by double clicking on the Excel file, but you need before Excel application and from there you have to select and open the needed file. The solution to avoid this annoying  problem in MS EXCEL 2007 is going in OPTION -> Advanced -> removing the flag: 'Ignore other applications tha use Dynamic Data Exchange' as you can see in the following image The same solution is applicable also in MS Excel 2003 and we guess in all the other versions!

Excel Best Practices in Xcelsius Dashboard

At designing your dashboard time in BO Dashborards or Xcelsius follow the best practices concerning  Microsoft Excel. Is suggest to avoid: - Array calculations as they can dramatically affect performance: 1. SUM 2. COUNT 3. SUMIF 4. COUNTIF 5. INDEX 6. MATCH 7. HLOOKUP 8. VLOOKUP 9. and similar - Repeating logic:     This example will run the SUM twice : IF(SUM(A1:A10),   , SUM(A1:A10))  Any calculations: They add overhead when loading or interacting with the dashboard They increase the time it takes to generate the flash file when you export or preview Is better to:  - Hard code values wherever possible instead of using formulas - Define calculations on the server side where possible - Use server side sorting to order your data and make the results easier to compare - Use server side ranking to limit the number or rows returned - Link to a report for detailed drill down - Use a selector with filtered rows instead of Excel lookups - Us

Variables that influence BO Dashboard Performances

Variables that impact on Dashboard  Load Time In order of importance: 1. Queries or connections that are set to Refresh Before Components Are Loaded.           This is the default setting for a query.            If you have any queries or connections set to refresh before components are              loaded the             Initializing message phase stays up until they have all completed. 2. Excel cells 3. Excel calculations 4. Components 5. Bindings from components to Excel (also size of ranges) 6. Dashboard file size Please Note: Default  maximum number or rows you can refer to in a formula or in a binding is  512  rows. You can  change this in  File  >  Preferences  >  Excel Options  (max recommended is  2000  rows) but this may affect the performance of your dashboard. See Also: SAP BusinessObjects Dashboards 4.0 - Spreadsheets

Using Microsoft Excel in BO Dashboards

Benefits from using Microsoft Excel in designing SAP BO Dashboards 4.0 Should you continue to use Microsoft Excel also in BO Dashoboard 4.0? Apart from Microsoft Excel having a wide reach among business users and being easy to use, there are three main benefits that Microsoft Excel provides when embedded inside the Dashboards designer: A Data Model. You can enter highly aggregated data directly into the spreadsheet and visualize it, so there is no need for a database. You can also pull in highly aggregated data from external sources, including SAP Business Warehouse (BW), SAP BusinessObjects Business Intelligence (BI) universes, XML and simple Web services. A Calculation Engine. In addition to Microsoft Excel having a very familiar and flexible formula language, it also provides a calculation engine. An Eventing Model. When a cell changes, we get a “data change” event. This is a very simple model, but we leverage it for more than just calculations. You can either start wi

SAP BusinessObjects Dashboard Builder Content Linking

Image
Dashboard Design (SWF)  to  Web Intelligence A Dashboard Design analytic used as a source document for Web Intelligence has to be configured with the FS Command connectivity . The parameters are then assembled in an OpenDocument URL by the Dashboard Builder framework. For more information about the OpenDocument syntax, please refer to Sap BO 4 Opendocument The connectivity between Dashboard Design and  WebI is very usefull  when summary data is displayed in the dashboard analytic  and  detailed data are available for a deep analysis in a WebI report. Let see how create a Content  Linking  setting Go to Dashboard Builder page: Create the  first   column in Dashboard Builder by importing the detailed Webi report that will be linked to the previous Dashboard Create the  second   column in Dashboard Builder by importing the Xcelsius Dashboard Define the content Linking Between the Xcelsius Dashboard ( named "Provider" in this example) and the W

SAP BO 4.0 Open Document

Talking about Open document there are several features that changed in the new Business Intelligence platform 4.0. changed compared to XI R3.1 version. Let's see some hints: The default URL to the OpenDocument web application bundle has changed in SAP BusinessObjects Business Intelligence platform 4.0. New absolute OpenDocument links need to use the new default URL: http:// : /BOE/OpenDocument/opendoc/openDocument.jsp? & &...& Below you will see a lists of deprecated and obsolete OpenDocument parameters as of SAP BusinessObjects Obsolete parameters are no more supported. sIDType=GUID    ->  Use sIDType=CUID instead. sIDType=RUID     ->   Use sIDType=CUID  instead. sKind                    -> Use iDocID instead.          Specifies the SI_KIND property of the target                                                                        Desktop Intelligence document. sPath                              sPath does not support the use of lo

SAP BO 4 - Live Office

Image
Life Office purpose To use Live Office to access corporate data,  you must connect to the SAP BusinessObjects Business Intelligence platform repository where documents are stored. When you attempt to search for, add, view, modify, or publish Live Office objects from a Microsoft Office application, if you are not already logged on to the BI platform, you are prompted to log on. You can configure Live Office to connect to SAP BusinessObjects Business Intelligence platform automatically each time Microsoft Office Excel, PowerPoint, Outlook, or Word is loaded. Live Office supports Single Sign-on (SSO) to the BI platform. If SSO is enabled, when users request report data, Live Office uses their SAP BusinessObjects Business Intelligence platform logon credentials to access the data source rather than requiring another logon. Live Office object types Crystal Reports ->  Fields: Yes   Report Parts: Yes Web Intelligence ->  Fields:  Not applicable  Parts: Yes U

Lifecycle management console & BO Dashboard

Image
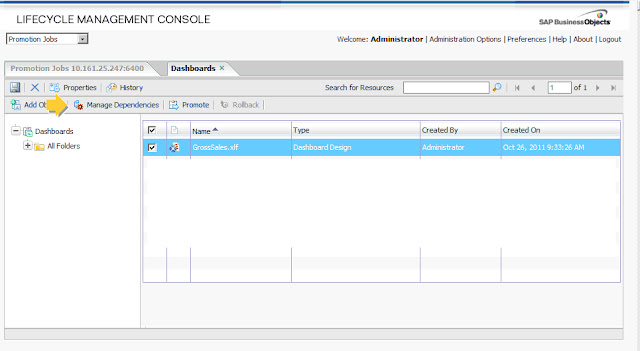
In the Lifecycle Management Console, the new Dashboard Objects allows to check relashionship with universe query, dependences on QaaWS and universe objects in QaaWS connections, and/or dependences on WebIntelligence reports, Crystal reports and Universe objects with Life Office Connections. All the dependent objects can be promoted together. See also: Lifecycle Management Console LCM Managing infoobject versions How to import or export with lifecycle from cmd line