Using SAP Visual Intelligence
Using SAP Visual Intelligence - Step by Step
Let's see how to create a chart with Visual Intelligence.1. Connect to your data source
If your data source is:
- RDBMS: Enter your credentials, connect to the database server, browse and select a data source.
If you are connecting to SAP HANA, you select a view and cube to build your chart.
- Flat file: Choose the columns to be acquired, trimmed, or shown and hidden.
- Universe: Enter your universe credentials, connect to the Central Management Server repository, and select a universe to build your chart.
2. View and organize the columns and attributes.
The data acquired can be viewed as columns or as facets. You can organize the data display to make chart building easier by doing the following:
- Create filters and hide unneeded columns.
- Create measures, time and geography hierarchies.
- Clean and organize the data in columns using a range of manipulation tools.
- Create columns with formulas using a wide selection of available functions.
Below a data grid in Visual Intelligence.
3. Choose a chart type.
You can build charts using:
- Split view that shows the dataset and the chart being built.
- Visualize view to work in a totally graphical environment when building your chart.
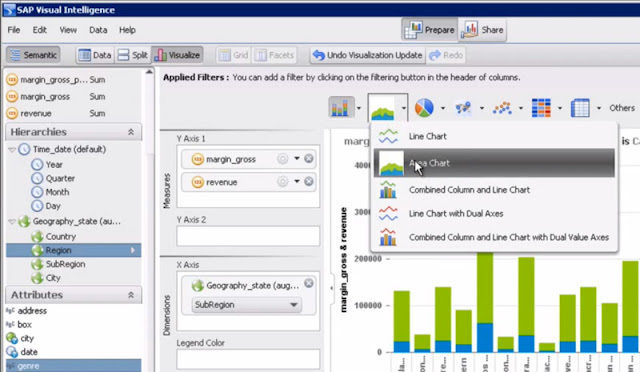
The selection of charts is arranged by family at the top of the Visualization pane.
In the following images is shown how to choose a chart:
4. Build your chart
You can build charts in three ways:
- Using the Chart feeder panel to the left of the Visualization Pane.
- Directly on the chart body area by dragging measures and attributes onto the chart body.
- Directly on an attribute: Select an attribute or measure, click the arrow to the right of the object name and select Make a new chart with or Add to current chart from the context menu.

5. Save your document
Name and save your document that includes your charts. It is stored locally in the application folder under Documents in your profile path.
6. Share your data or chart
You can do the following with your data, chart, or both:
- Share your chart
- Export your dataset to a file
- Publish your data to SAP HANA as an analytic view
- Publish your data and charts to Streamwork
Related posts:
SAP Visual Intelligence
SAP VISUAL INTELLIGENCE FEATURES
Connect SAP Visual Intelligence to data sources


Hi, probably our entry may be off topic but anyways, I have been surfing around your blog and it looks very professional. It’s obvious you know your topic
ReplyDeleteand you appear fervent about it. I’m developing a fresh blog plus I’m struggling to make it look good, as well as offer the best quality content. I have
learned much at your web site and also I anticipate alot more articles and will be coming back soon. Thanks you.
SAP HANA Training in London UK
Thank you Shyam
ReplyDelete