Posts

SAP HANA REPLICATION DATA

Image
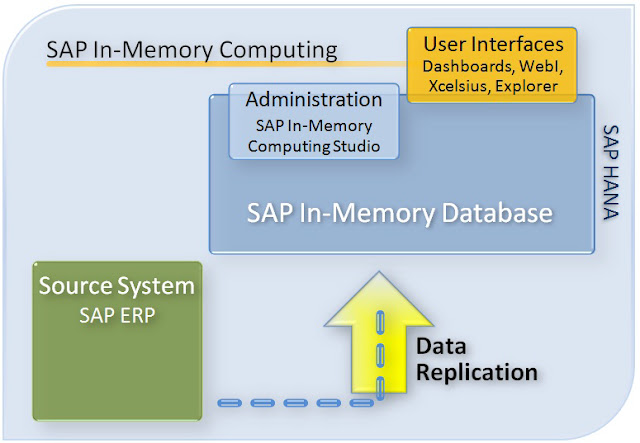
SAP In-Memory reporting and analyzing of business data requires the replication of the data from a source system to SAP In-Memory Database (IMDB). Let see an overview of the possible replication methods that are available for SAP In-Memory Appliance (SAP HANA 1.0) and its the application fields and the main components required for each method. There are three methods available for performing the data replication.  The main components involved in all replication scenarios are: • SAP HANA, consisting of the IMDB and SAP In-Memory Computing Studio, which is used to administer the appliance. User interfaces, such as SAP BusinessObjects Dashboards or Web Intelligence or Visual  Intelligence. • Source system, such as SAP ERP • Software components supporting the data replication The software components that support different methods of data replication are described in the following  three replication scenarios. There are three alternative methods for data repli

BUSINESS OBJECTS ERRORS LIST

Hello Everybody, would you help to collect more frequent BO Errors,  better if indicating BO version? If you want you can also write down your personal fix or standard solution. This could by useful for somebody. Thanks in advance for co-operating! Best regards Giuseppe SAP BI 4 - Scheduling reports error - source file error. [Invalid argument]: [CrystalEnterprise.DiskUnmanaged] wij-20002 error webi rich client Internal error Error RFC 00101 - No server was available to process the request FWM 00001 Transport error: Communication failure. Error WIS 30272 - Max character file size limit exceeded Error WIS 00509 - Universe data connection could not be found Error RWI 00323 - Cannot retrieve the document with the passed obsolete token Error RWI 00239 - Connection failed. The server has reached the maximum number of simultaneous connections Error RWI 00239 - The maximum number of server connections allowed has been reached Error RWI 00322 - An error occurred whi

Strategy Builder in Performance Manager

Strategy Builder in Performance Manager Environment: Business Objects XI R 3.1 SP3 Strategy Builder is useful because: • It allows companies to set and manage strategies for using enterprise information. • It ties information usage to business roles and objectives. • It optimizes information usage around the extended enterprise. A key element of Strategy Builder is its awareness of the corporate organization structure.  It takes into account the roles that are in the company, and ensures that the appropriate people are getting the appropriate information. The Strategy Builder has four tabs: • Home • Strategy • Catalog • Organization When you open Strategy Builder, the Strategy Builder schema appears on the main panel. Click objects in the map to see the different areas of Strategy Builder. The "Strategy" tab in Performance Manager Strategy Builder offers an overall perspective on the strategy hierarchy tree defined within Performance Manager. Navigate dir

SAP VISUAL INTELLIGENCE FEATURES

VISUAL INTELLIGENCE FEATURES AND EVOLUTION A new BI general need  about a fast data visualization that enables  interactive data visualization and self consumption is now covered by SAP with SAP VISUAL INTELLIGENCE. Through  Visual Intelligence SAP aims to answer the growing demand for self-service data visualization in order to realize an analytic dashboard tool. SAP Visual Intelligence was originally released during the May 2012 SAPPHIRE NOW event, and a new version, was released as Feature Pack 3 for BI BusinessObjects 4 . Concerning  power and complexity, SAP Visual Intelligence is positionated between the dashboards such as SAP BusinessObjects Dashboards (a.k.a Xcelsius) and SAP Zen, and the self-service web and mobile tools of SAP BusinessObjects Explorer. SAP Visual Intelligence is part of the SAP BusinessObjects Explorer family, but while BusinessObjects Explorer allows for data exploration and visualization via a web service or through a mobile app, SAP Visual Intelli

Excel Best Practices in Xcelsius Dashboard

At designing your dashboard time in BO Dashborards or Xcelsius follow the best practices concerning  Microsoft Excel. Is suggest to avoid: - Array calculations as they can dramatically affect performance: 1. SUM 2. COUNT 3. SUMIF 4. COUNTIF 5. INDEX 6. MATCH 7. HLOOKUP 8. VLOOKUP 9. and similar - Repeating logic:     This example will run the SUM twice : IF(SUM(A1:A10),   , SUM(A1:A10))  Any calculations: They add overhead when loading or interacting with the dashboard They increase the time it takes to generate the flash file when you export or preview Is better to:  - Hard code values wherever possible instead of using formulas - Define calculations on the server side where possible - Use server side sorting to order your data and make the results easier to compare - Use server side ranking to limit the number or rows returned - Link to a report for detailed drill down - Use a selector with filtered rows instead of Excel lookups - Us

Variables that influence BO Dashboard Performances

Variables that impact on Dashboard  Load Time In order of importance: 1. Queries or connections that are set to Refresh Before Components Are Loaded.           This is the default setting for a query.            If you have any queries or connections set to refresh before components are              loaded the             Initializing message phase stays up until they have all completed. 2. Excel cells 3. Excel calculations 4. Components 5. Bindings from components to Excel (also size of ranges) 6. Dashboard file size Please Note: Default  maximum number or rows you can refer to in a formula or in a binding is  512  rows. You can  change this in  File  >  Preferences  >  Excel Options  (max recommended is  2000  rows) but this may affect the performance of your dashboard. See Also: SAP BusinessObjects Dashboards 4.0 - Spreadsheets

Using Microsoft Excel in BO Dashboards

Benefits from using Microsoft Excel in designing SAP BO Dashboards 4.0 Should you continue to use Microsoft Excel also in BO Dashoboard 4.0? Apart from Microsoft Excel having a wide reach among business users and being easy to use, there are three main benefits that Microsoft Excel provides when embedded inside the Dashboards designer: A Data Model. You can enter highly aggregated data directly into the spreadsheet and visualize it, so there is no need for a database. You can also pull in highly aggregated data from external sources, including SAP Business Warehouse (BW), SAP BusinessObjects Business Intelligence (BI) universes, XML and simple Web services. A Calculation Engine. In addition to Microsoft Excel having a very familiar and flexible formula language, it also provides a calculation engine. An Eventing Model. When a cell changes, we get a “data change” event. This is a very simple model, but we leverage it for more than just calculations. You can either start wi