Posts

Showing posts with the label SAP BO Dashboards

SAP BO Dashboards 4 - Binding chart to the query objects

Image
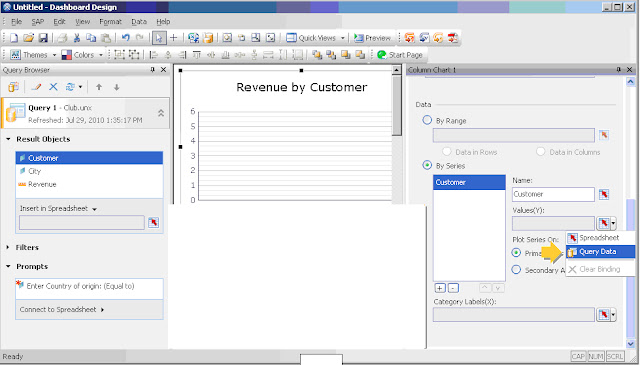
Binding chart to the query objects The great  new feature in SAP BO Dashboards allows to bind every single component of the dashboard  (charts, gauge and so on) directly to the query on the universe, this operation avoids to import values on the sheet in order to map    the component. Please note that when data is directly bound to a chart or other component this object will not display data in Design mode so you need to preview or publish the dashboard in order to view data. New components for Universe Connectivity: Query prompt selector  enables users to select one or more values for the prompt accordfing the operator used in the query. Please note that when a prompt selector is dragged to the canvass automaticcally it is added to the dahsboard. Query refresh button this allows users to refresh  data directly on demand in the dashboard   In SAP BO Dashboards 4.0 is now possible to  apply a   dynamic regional date, time, currency and numb

SAP BO DASHBOARDS 4.0 New Features

Image
SAP BO DASHBOARDS 4.0   Servers In SAP Business Objects BI 4, BO Dashboard has been integrating in CMC management (auditing and monitoring included) as concerns the management of two new servers: DashboardDesignCacheServer DashboardDesignProcessingServer which support better performance and scalabilty. the first server provides data caching and sharing while the second manages query processes requests A great new feature of SAP BO Dashboard 4.0 is provided by the direct connection to a Universe trough a Query panel , the user interface is like WebI one so objects like dimensions and misures can be selected directly, besides you can apply filters,  sorts, prompts and you can preview the query data. The query  browser panel enables the dashboard designer to manage query on the universe, displaying the summary of result obejects, prompts and filters for each query launched providing in this way a quick access to tool to create, edit and refresh queries.

BO Dashboards 4.0 Supported Excel functions

SAP BusinessObjects Dashboards 4.0 Supported Excel functions The SAP BO  Dashboards 4.0   supports the following Excel functions: A ABS ACOS ACOSH ADDRESS AND ASIN ASINH ASSIGN ATAN ATAN2 ATANH AVEDEV AVERAGE AVERAGEA AVERAGEIF B BETADIST C CEILING CHAR CHOOSE COLUMNS COMBIN CONCATENATE CORREL COS COSH COUNTIF Note: If used with large data sets, this function could affect performance. COUNT COUNTA COVAR D DATE DATEVALUE DAVERAGE DAY DAYS360 DB DCOUNT DCOUNTA DDB DEGREES DEVSQ DGET DIVIDE DMAX DMIN DOLLAR DPRODUCT DSTDEV DSSTDEVP DSUM DVAR DVARP E EDATE EFFECT EOMONTH EVEN EXACT EXP EXPONDIST F FACT FACTDOUBLE FALSE FIND FISHER FISHERINV FIXED FLOOR FORECAST FV G G GE GEOMEAN GT H H HLOOKUP  Note: If used with large data sets, this function could affect performance. HOUR HARMEAN I I IF INDEX INT INTERCEPT IPMT IRR ISBLANK ISERR ISERROR ISEVEN ISLOGICAL ISNA ISNONT

SAP BusinessObjects Dashboards 4.0 - Spreadsheets

How to prepare Excel spreadsheets Before you import an Excel spreadsheet, make sure the spreadsheet provides a good structure for achieving the best performance for models. Consider the following guidelines: - Use only supported Excel functions For a list of supported Excel functions, see Supported Excel functions . - Use these Excel functions with small data sets only The following Excel functions are supported in Dashboard Design and Presentation Design, but can affect the model's performance if used with larger data sets (over 100 rows): • SUMIF • COUNTIF • HLOOKUP • VLOOKUP Note: If you must access larger data sets, have the server or database perform the aggregation on the server side. - Organize your data in a logical fashion To make your spreadsheet easier to understand, lay out your data in a logical fashion. Group related items together and use colors, labels, and borders to describe the structure and function of cells. - Use colors

XCELSIUS SALES DASHBOARD TEMPLATE

Image
Let's see how you could organize  a Dashboard concerning Sales In the home page it's possible to analize the summary situation about: Brand Income and incidence Monthly Comparison Income Vs Budget Current Year Income vs Last Year Income (gauge ) Current Year Income vs Budget  (gauge ) Weekly trend Current Income, Budget, Last year Income Geographical Maps Shows Income vs Budget vs Last year Income for the selected Country Store Page Allow to select a country and a specific Store sign: in order to analize the summary situation about : Brand Income and incidence Monthly Comparison Income Vs Budget Current Year Income vs Last Year Income (gauge ) Current Year Income vs Budget  (gauge ) Weekly trend Current Income, Budget, Last year Income Others Dashboards template: Xcelsius Dashboard template files World Sales Dashboard template For detailed information please see: Sap Dashboard -Xcelsius 2008 Sap BO dashboards 4.0 New features

Xcelsius - Using Query as Web Services in a Dashboard

Image
How to create a Query As A Web Services  Open the BO tool Query As A Web Services from Programs -Business Objects  Log on Business Objects  Server  Insert the  Web Services url: http:/SERVERNAME:8080/dswbobje/services/Session Give a name to the Web Service Assign value to advanced parameters: Select the Universe on wich you need to create a query: Create your query selecting the available objects in the universe After executing the query will appear a data preview Finally you have to publish the query on CMS Now open Xcelsius 2008  and Create a Connection  to a QAAWS After this Xcelsius will retrieve data in order to create charts and all the Dashboard objects: Xcelsius & SAP Dashboards Sap BO dashboards 4.0 New features

Sap BO Dashboards 4.0 - Xcelsius 2008

Image
Creating Dashboards with Xcelsius 2008       Xcelsius 2008 is a tool with an intuitive user interface used  for creating interactive dashboard  based on aggregated data sets. This tool can easily be used by business users, infact  no programming skills are necessary for creating Xcelsius dashboard.  That is possible because in  Xcelsius  data aggregation logic  and  creation of  objects (such as charts, tabs, gauges, sliders) is based on  Microsoft Excel functions and features.         Xcelsius 2008 uses the embedded Microsoft Excel spreadsheet        for three things at   design stage:   1.    row and column based staging area for  data aggregation. 2.    uses well knew Excel functions to provide additional logic. 3.    allow Excel formatting (for cell, colors, numbers).           The following image is shown Xcelsius canvass, the tool saves the dashboard project as an XLF file. Final Xcelisus output is obtained  with an export in several format: Flash

SAP BUSINESS OBJECTS EXPLORER

Image
Business Objects Explorer ( before knew as B.O. Polestar )  is a tool whose demand on the market is  growing widly  , it allow navigating trough company data giving user the chance to make analisys by himself very easily. It's very user friendly and intuitive so user can explore data without needing training. Business Objects Explorer: Empowers business users to easily create, navigate & share key business views. Highly Personalized & Dynamic Experience Leverage investments in Business Objects Enterprise, Explorer , in-memory data sources (HANA, BWA) & Semantic Layer Smart visualization with auto adapting Views on mobile devices.- Interact and analyze make informed business decisions. It allows an interactive analisys just selecting one or more occourences from several dimensions and measures available. You can also change the chart type choosing it from the left panel on the bottom size of the page, and analize two measures selecting them from the f